$371,900
3 bd|3 ba|1.5k sqft
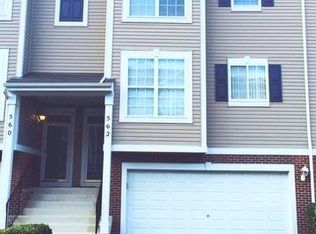
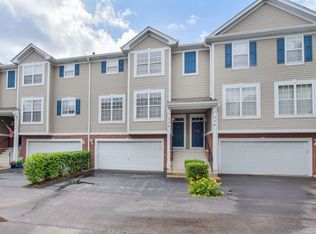
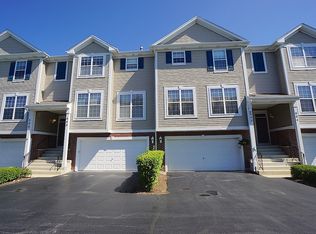
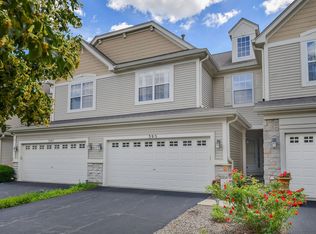
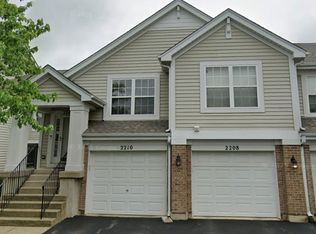
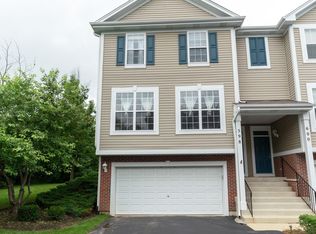
598 Declaration Ln, Aurora, IL 60502
Off Market
Zillow last checked:
Listing updated:
Cleo Connor 708-359-9693,
1Stop4homes, Inc.
Not available
Estimated sales range
Not available
Not available
| Date | Event | Price |
|---|---|---|
| 7/3/2026 | Listed for sale | $315,000+37%$229/sqft |
Source: | ||
| 12/22/2021 | Sold | $230,000-4.1%$167/sqft |
Source: | ||
| 11/15/2021 | Contingent | $239,900$174/sqft |
Source: | ||
| 10/19/2021 | Listed for sale | $239,900+45.4%$174/sqft |
Source: | ||
| 1/29/2020 | Listing removed | $1,650$1/sqft |
Source: Best U.S. Realty Report a problem | ||
| 1/11/2020 | Listed for rent | $1,650+11.9%$1/sqft |
Source: Best U.S. Realty Report a problem | ||
| 12/16/2019 | Sold | $165,000-21.6%$120/sqft |
Source: Public Record Report a problem | ||
| 10/11/2019 | Listing removed | $1,475-3.3%$1/sqft |
Source: Homeriver Group Report a problem | ||
| 9/10/2019 | Listed for rent | $1,525$1/sqft |
Source: Zillow Rental Network Premium Report a problem | ||
| 1/22/2019 | Listing removed | $1,525$1/sqft |
Source: Homeriver Group Report a problem | ||
| 1/3/2019 | Price change | $1,525-5%$1/sqft |
Source: Zillow Rental Network Premium Report a problem | ||
| 12/18/2018 | Price change | $1,605+0.6%$1/sqft |
Source: Zillow Rental Network Premium Report a problem | ||
| 12/3/2018 | Listed for rent | $1,595$1/sqft |
Source: Zillow Rental Network Premium Report a problem | ||
| 5/21/2018 | Listing removed | $210,500$153/sqft |
Source: Century 21 Lullo #09956679 Report a problem | ||
| 5/19/2018 | Listed for sale | $210,500+5.8%$153/sqft |
Source: Century 21 Lullo #09956679 Report a problem | ||
| 5/12/2008 | Listing removed | $199,000$145/sqft |
Source: Visual Tour #06866470 Report a problem | ||
| 4/23/2008 | Listed for sale | $199,000+22.1%$145/sqft |
Source: Visual Tour #06866470 Report a problem | ||
| 6/25/2002 | Sold | $163,000$118/sqft |
Source: Public Record Report a problem | ||
| Year | Property taxes | Tax assessment |
|---|---|---|
| 2024 | $5,742 +4.1% | $75,521 +11.3% |
| 2023 | $5,515 +9.7% | $67,860 +13.2% |
| 2022 | $5,026 +2.5% | $59,930 +3.7% |
| 2021 | $4,903 -1.2% | $57,790 |
| 2020 | $4,962 +3.4% | $57,790 +5.1% |
| 2019 | $4,801 +5.1% | $54,960 +6.2% |
| 2018 | $4,570 +1.5% | $51,740 +3.5% |
| 2017 | $4,503 +16.1% | $49,980 +4.2% |
| 2016 | $3,880 +1.4% | $47,960 +5.3% |
| 2015 | $3,825 +1.9% | $45,540 +4.3% |
| 2014 | $3,753 +1% | $43,670 -0.7% |
| 2013 | $3,716 -5.3% | $43,970 -8.9% |
| 2012 | $3,924 +2% | $48,250 -6.4% |
| 2011 | $3,847 +0.6% | $51,570 -4.6% |
| 2010 | $3,825 +2.8% | $54,030 -4% |
| 2009 | $3,721 +2.6% | $56,280 +1.8% |
| 2008 | $3,627 +4.2% | $55,280 +5.8% |
| 2007 | $3,481 +0.5% | $52,250 +2.7% |
| 2006 | $3,463 +5.4% | $50,870 +7.7% |
| 2005 | $3,286 +4.3% | $47,220 +3.8% |
| 2004 | $3,150 +1.7% | $45,490 +6.8% |
| 2003 | $3,097 | $42,590 |
Source: MRED as distributed by MLS GRID. This data may not be complete. We recommend contacting the local school district to confirm school assignments for this home.
A local agent can set up tours, give advice and negotiate with sellers.