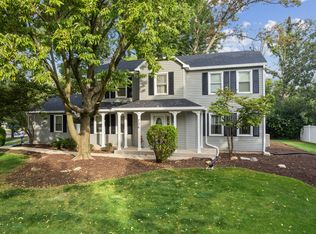
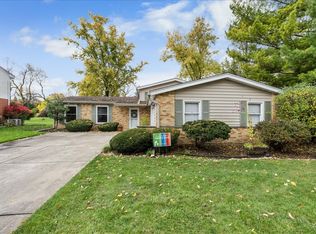
$354,900
-- bd2 ba1.2k sqft
309 Sulgrave Ct, Bolingbrook, IL 60440
Off Market
Listing description withheld by the listing agent.
Zillow last checked:
Listing updated:
Samantha Laba 708-264-6377,
Realty One Group Heartland

Not available
Estimated sales range
Not available
Not available
| Date | Event | Price |
|---|---|---|
| 11/7/2026 | Listed for sale | $499,999+69.5%$230/sqft |
Source:  MRED as distributed by MLS GRID #12800977 Report a problem | ||
| 8/18/2026 | Sold | $295,000-12.6%$136/sqft |
Source: MRED as distributed by MLS GRID #12679409 Report a problem | ||
| 8/11/2026 | Pending sale | $337,500$155/sqft |
Source: MRED as distributed by MLS GRID #12679409 Report a problem | ||
| 7/8/2026 | Listed for sale | $337,500$155/sqft |
Source: MRED as distributed by MLS GRID #12679409 Report a problem | ||
| Year | Property taxes | Tax assessment |
|---|---|---|
| 2025 | $8,499 +4.7% | $116,193 +8.5% |
| 2024 | $8,114 +4.9% | $107,061 +9.6% |
| 2023 | $7,737 +7.6% | $97,710 +10% |
| 2022 | $7,188 +4.7% | $88,830 +3.9% |
| 2021 | $6,866 +2% | $85,470 +1.8% |
| 2020 | $6,735 +9.8% | $83,930 +4.5% |
| 2019 | $6,132 +4.6% | $80,300 +6.6% |
| 2018 | $5,861 +3.4% | $75,360 +3.5% |
| 2017 | $5,670 +1.3% | $72,820 +3.7% |
| 2016 | $5,598 -0.4% | $70,190 +4% |
| 2015 | $5,622 -7.3% | $67,480 -5% |
| 2014 | $6,067 +1.9% | $71,030 -0.2% |
| 2013 | $5,952 +3.2% | $71,200 -3.7% |
| 2012 | $5,765 +4.4% | $73,970 -5.9% |
| 2011 | $5,523 +0% | $78,640 -6.2% |
| 2010 | $5,521 +3.6% | $83,850 -5% |
| 2009 | $5,328 +3.4% | $88,250 +1.4% |
| 2008 | $5,151 +3.8% | $87,030 +5.9% |
| 2007 | $4,962 +9.4% | $82,180 +11.7% |
| 2006 | $4,537 -1.1% | $73,560 +6.7% |
| 2005 | $4,590 +3.7% | $68,940 +5.9% |
| 2004 | $4,427 +6.2% | $65,100 +8.4% |
| 2003 | $4,168 +11.1% | $60,050 +8.4% |
| 2002 | $3,750 +9.9% | $55,380 +7.5% |
| 2001 | $3,414 +2.3% | $51,520 +5.9% |
| 2000 | $3,339 | $48,650 |
Source: MRED as distributed by MLS GRID. This data may not be complete. We recommend contacting the local school district to confirm school assignments for this home.

A local agent can set up tours, give advice and negotiate with sellers.
A local lender can help you make sure your offer is ready when you are.