$195,200
4 bd|2 ba|1.5k sqft
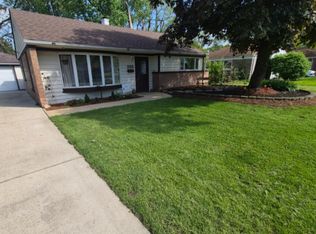
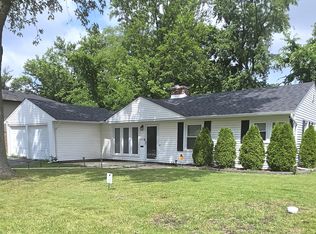
308 New Salem St, Park Forest, IL 60466
Off Market
Zillow last checked:
Lorraine Lanigan 708-478-1212,
Village Realty, Inc.
Not available
Estimated sales range
Not available
Not available
| Date | Event | Price |
|---|---|---|
| 3/5/2026 | Listing removed | $175,000$145/sqft |
Source: | ||
| 12/18/2025 | Price change | $175,000+9.4%$145/sqft |
Source: | ||
| 6/6/2025 | Listed for sale | $160,000+175.9%$132/sqft |
Source: | ||
| 7/13/2018 | Listing removed | $1,200$1/sqft |
Source: Zillow Rental Network Report a problem | ||
| 6/27/2018 | Listed for rent | $1,200$1/sqft |
Source: Zillow Rental Network Report a problem | ||
| 11/20/2017 | Listing removed | $58,000$48/sqft |
Source: Prestige Partners Realty Inc. #09760276 Report a problem | ||
| 10/13/2017 | Price change | $58,000-14.7%$48/sqft |
Source: Prestige Partners Realty Inc. #09760276 Report a problem | ||
| 9/25/2017 | Price change | $68,000-24.4%$56/sqft |
Source: Prestige Partners Realty Inc. #09760276 Report a problem | ||
| 9/16/2017 | Listed for sale | $89,999+233.3%$74/sqft |
Source: Prestige Partners Realty Inc. #09753007 Report a problem | ||
| 6/23/2016 | Sold | $27,000$22/sqft |
Source: | ||
| 5/16/2016 | Pending sale | $27,000$22/sqft |
Source: Prestige Partners Realty, Inc. #09219450 Report a problem | ||
| 5/8/2016 | Listed for sale | $27,000-82.4%$22/sqft |
Source: Prestige Partners Realty Inc. #09219450 Report a problem | ||
| 4/5/2007 | Sold | $153,000+61.9%$127/sqft |
Source: | ||
| 7/16/1996 | Sold | $94,500$78/sqft |
Source: Public Record Report a problem | ||
| Year | Property taxes | Tax assessment |
|---|---|---|
| 2024 | -- | $14,000 |
| 2023 | $6,944 +30% | $14,000 +64.6% |
| 2022 | $5,341 -1.6% | $8,507 |
| 2021 | $5,429 +5.4% | $8,507 |
| 2020 | $5,152 +6.4% | $8,507 -3.5% |
| 2019 | $4,840 +2.7% | $8,820 |
| 2018 | $4,712 -37.2% | $8,820 |
| 2017 | $7,499 +43.1% | $8,820 -0.2% |
| 2016 | $5,239 +4.4% | $8,836 |
| 2015 | $5,017 +2.5% | $8,836 |
| 2014 | $4,894 -6.8% | $8,836 -13% |
| 2013 | $5,251 +4.8% | $10,155 |
| 2012 | $5,011 +2.3% | $10,155 |
| 2011 | $4,900 -7.9% | $10,155 -19.6% |
| 2010 | $5,320 +2.6% | $12,623 |
| 2009 | $5,184 +10.1% | $12,623 -5% |
| 2008 | $4,707 +14.4% | $13,288 +2.5% |
| 2007 | $4,113 -17.4% | $12,960 |
| 2006 | $4,979 +139.8% | $12,960 |
| 2005 | $2,076 -8.7% | $12,960 +15.8% |
| 2004 | $2,274 +0.7% | $11,195 |
| 2003 | $2,258 +5.4% | $11,195 |
| 2002 | $2,142 -7.2% | $11,195 +9.1% |
| 2001 | $2,309 +3% | $10,260 |
| 2000 | $2,241 | $10,260 |
| 1999 | $2,241 | $10,260 |
Source: MRED as distributed by MLS GRID. This data may not be complete. We recommend contacting the local school district to confirm school assignments for this home.
A local agent can set up tours, give advice and negotiate with sellers.
A local lender can help you make sure your offer is ready when you are.