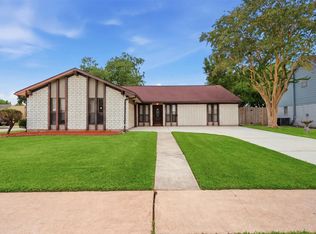
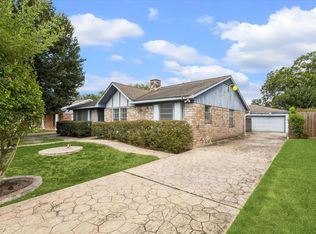
$272,100
5 bd2 ba2.4k sqft
11606 Sagemeadow Ln, Houston, TX 77089
Off Market
Zillow last checked:
Listing updated:
Juanmiguel Villarreal TREC #0598726 281-914-6675,
Reimage Properties & Investments, LLC.

$328,600
$312,000 - $345,000
$2,759/mo
| Date | Event | Price |
|---|---|---|
| 9/8/2026 | Listed for sale | $335,000+76.3%$161/sqft |
Source:  HAR #45170277 Report a problem | ||
| 10/21/2017 | Listing removed | $189,999$91/sqft |
Source: Keller Williams Hou Preferred #68939218 Report a problem | ||
| 10/20/2017 | Listed for sale | $189,999$91/sqft |
Source: Keller Williams Hou Preferred #68939218 Report a problem | ||
| 10/19/2017 | Sold | -- |
Source: Agent Provided Report a problem | ||
| 10/16/2017 | Pending sale | $189,999$91/sqft |
Source: Keller Williams Hou Preferred #68939218 Report a problem | ||
| 10/16/2017 | Listed for sale | $189,999$91/sqft |
Source: Keller Williams Hou Preferred #68939218 Report a problem | ||
| 9/8/2017 | Listing removed | $189,999$91/sqft |
Source: Keller Williams Hou Preferred #68939218 Report a problem | ||
| 8/14/2017 | Pending sale | $189,999$91/sqft |
Source: Keller Williams Houston Preferred #68939218 Report a problem | ||
| 8/10/2017 | Price change | $189,999-5%$91/sqft |
Source: Keller Williams Houston Preferred #68939218 Report a problem | ||
| 7/27/2017 | Listed for sale | $199,999$96/sqft |
Source: Keller Williams Hou Preferred #68939218 Report a problem | ||
| 2/10/1998 | Sold | -- |
Source: Public Record Report a problem | ||
| Year | Property taxes | Tax assessment |
|---|---|---|
| 2025 | $1,850 +6.5% | $294,083 +3.1% |
| 2024 | $1,737 +13.8% | $285,373 |
| 2023 | $1,527 +17.4% | $285,373 +17.5% |
| 2022 | $1,301 | $242,905 +18.8% |
| 2021 | -- | $204,535 +13.3% |
| 2020 | $1,091 +2.5% | $180,594 +4.7% |
| 2019 | $1,064 -70% | $172,569 +3.4% |
| 2018 | $3,544 | $166,891 |
| 2017 | $3,544 +11.1% | $166,891 +11.9% |
| 2016 | $3,190 +9.1% | $149,089 +4.6% |
| 2015 | $2,925 | $142,468 +7.9% |
| 2014 | $2,925 | $131,996 +7.3% |
| 2013 | -- | $123,003 |
| 2012 | -- | $123,003 -5.5% |
| 2011 | -- | $130,127 |
| 2010 | -- | $130,127 |
| 2009 | -- | $130,127 +5.4% |
| 2007 | -- | $123,460 |
| 2006 | -- | $123,460 |
| 2005 | -- | $123,460 |
| 2004 | -- | $123,460 |
| 2003 | -- | $123,460 +9.6% |
| 2002 | -- | $112,670 |
| 2001 | -- | $112,670 +33.3% |
| 2000 | -- | $84,540 |
Source: HAR. This data may not be complete. We recommend contacting the local school district to confirm school assignments for this home.
A local agent can set up tours, give advice and negotiate with sellers.