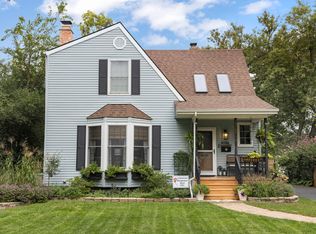
$250,000
2 bd3 ba1.9k sqft
17841 Howe Ave, Homewood, IL 60430
Sold

Listing description withheld by the listing agent.
Zillow last checked:
Listing updated:
Ashiana Allen 708-629-0935,
A Progeny Global LLC

Not available
Estimated sales range
Not available
Not available
| Date | Event | Price |
|---|---|---|
| 10/26/2026 | Listed for sale | $460,000+49.8%$135/sqft |
Source:  MRED as distributed by MLS GRID #12793682 Report a problem | ||
| 7/23/2019 | Sold | $307,000-5.5%$90/sqft |
Source: MRED as distributed by MLS GRID #10255350 Report a problem | ||
| 6/10/2019 | Pending sale | $324,900$95/sqft |
Source: Keller Williams NW Indiana #10255350 Report a problem | ||
| 5/25/2019 | Price change | $324,900-4.4%$95/sqft |
Source: Keller Williams NW Indiana #10255350 Report a problem | ||
| 5/11/2019 | Price change | $339,900-2.9%$100/sqft |
Source: Keller Williams NW Indiana #10255350 Report a problem | ||
| 4/5/2019 | Price change | $349,900-6.7%$103/sqft |
Source: Keller Williams NW Indiana #10255350 Report a problem | ||
| 2/5/2019 | Listed for sale | $374,900+63%$110/sqft |
Source: Keller Williams NW Indiana #10255350 Report a problem | ||
| 6/12/2009 | Sold | $230,000-17.6%$67/sqft |
Source: MRED as distributed by MLS GRID #07194440 Report a problem | ||
| 2/27/2009 | Price change | $279,000-4.5%$82/sqft |
Source: Homes.com #07075244 Report a problem | ||
| 1/29/2009 | Price change | $292,000-2.3%$86/sqft |
Source: Homes.com #07075244 Report a problem | ||
| 1/1/2009 | Price change | $299,000-3.5%$88/sqft |
Source: Homes.com #07075244 Report a problem | ||
| 11/22/2008 | Listed for sale | $310,000-22.3%$91/sqft |
Source: Homes.com #07075244 Report a problem | ||
| 7/13/2006 | Sold | $399,000-6.1%$117/sqft |
Source: Public Record Report a problem | ||
| 6/30/2005 | Sold | $425,000+80.9%$125/sqft |
Source: Public Record Report a problem | ||
| 3/30/1999 | Sold | $235,000$69/sqft |
Source: Public Record Report a problem | ||
| Year | Property taxes | Tax assessment |
|---|---|---|
| 2024 | -- | $44,001 +0% |
| 2023 | $6,813 -45% | $43,999 +66% |
| 2022 | $12,388 | $26,512 |
| 2021 | -- | $26,512 |
| 2020 | -- | $26,512 -10.7% |
| 2019 | $7,014 -45% | $29,678 |
| 2018 | $12,753 -0.3% | $29,678 |
| 2017 | $12,796 +6.3% | $29,678 +11% |
| 2016 | $12,033 +1.5% | $26,732 |
| 2015 | $11,858 +1.7% | $26,732 |
| 2014 | $11,661 -12.6% | $26,732 -18.3% |
| 2013 | $13,340 +1.6% | $32,733 |
| 2012 | $13,124 -0.9% | $32,733 |
| 2011 | $13,248 -0.6% | $32,733 -12.8% |
| 2010 | $13,321 +21.4% | $37,541 |
| 2009 | $10,970 -13.8% | $37,541 -5% |
| 2008 | $12,733 +24.4% | $39,517 +18.8% |
| 2007 | $10,237 +14.4% | $33,255 |
| 2006 | $8,951 -25.6% | $33,255 -10.4% |
| 2005 | $12,037 +43.5% | $37,135 +34.7% |
| 2004 | $8,387 +0.1% | $27,569 |
| 2003 | $8,380 +16.3% | $27,569 +17.3% |
| 2002 | $7,205 +11.4% | $23,500 |
| 2001 | $6,468 -10.1% | $23,500 |
| 2000 | $7,191 -21.8% | $23,500 |
| 1999 | $9,199 | $23,500 |
Source: MRED as distributed by MLS GRID. This data may not be complete. We recommend contacting the local school district to confirm school assignments for this home.

A local agent can set up tours, give advice and negotiate with sellers.
A local lender can help you make sure your offer is ready when you are.