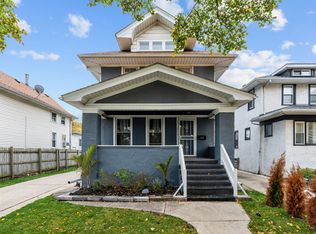
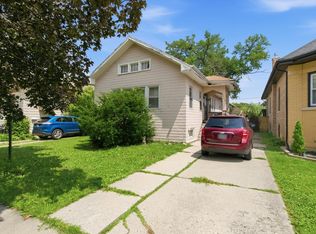
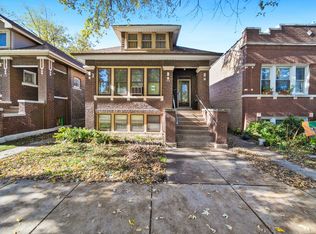
$227,200
4 bd1 ba1.5k sqft
209 S 2nd Ave, Maywood, IL 60153
Off Market
Listing description withheld by the listing agent.
Likely to sell faster than
Zillow last checked:
Listing updated:
Jesmely Gonzalez 630-697-0934,
Realty of America, LLC

Not available
Estimated sales range
Not available
Not available
| Date | Event | Price |
|---|---|---|
| 9/26/2024 | Listing removed | $240,000$106/sqft |
Source:  MRED as distributed by MLS GRID #12161858 Report a problem | ||
| 9/12/2024 | Listed for sale | $240,000+20%$106/sqft |
Source: MRED as distributed by MLS GRID #12161858 Report a problem | ||
| 8/7/2019 | Sold | $200,000+0.9%$89/sqft |
Source: MRED as distributed by MLS GRID #10414574 Report a problem | ||
| 6/24/2019 | Pending sale | $198,123$88/sqft |
Source: Alicia Ruiz #10414574 Report a problem | ||
| 6/12/2019 | Price change | $198,123-2.5%$88/sqft |
Source: Alicia Ruiz #10414574 Report a problem | ||
| 5/31/2019 | Listed for sale | $203,123$90/sqft |
Source: Alicia Ruiz #10414574 Report a problem | ||
| 5/9/2019 | Pending sale | $203,123$90/sqft |
Source: Alicia Ruiz #10414574 Report a problem | ||
| 4/29/2019 | Listed for sale | $203,123+69.3%$90/sqft |
Source: Alicia Ruiz #10414574 Report a problem | ||
| 8/21/2017 | Listing removed | $1,500$1/sqft |
Source: Zillow Rental Manager Report a problem | ||
| 8/19/2017 | Listed for rent | $1,500$1/sqft |
Source: Zillow Rental Manager Report a problem | ||
| 4/18/2013 | Sold | $120,000-6.3%$53/sqft |
Source: MRED as distributed by MLS GRID #08226303 Report a problem | ||
| 12/17/2012 | Listed for sale | $128,000+540%$57/sqft |
Source: McIntosh Realty Report a problem | ||
| 9/19/2012 | Sold | $20,000-85.2%$9/sqft |
Source: Public Record Report a problem | ||
| 10/25/2000 | Sold | $135,000$60/sqft |
Source: Public Record Report a problem | ||
| Year | Property taxes | Tax assessment |
|---|---|---|
| 2024 | $10,137 +8.5% | $25,000 +0% |
| 2023 | $9,342 +64.2% | $24,999 +84.8% |
| 2022 | $5,690 -1.3% | $13,526 |
| 2021 | $5,764 -36.3% | $13,526 -17.6% |
| 2020 | $9,050 +53.2% | $16,420 +28.5% |
| 2019 | $5,906 +2.9% | $12,777 |
| 2018 | $5,742 +2.8% | $12,777 |
| 2017 | $5,584 +7.1% | $12,777 +17.3% |
| 2016 | $5,212 +8.9% | $10,890 |
| 2015 | $4,785 -30.5% | $10,890 -16.2% |
| 2014 | $6,881 +41.6% | $12,998 +2.5% |
| 2013 | $4,860 +3.3% | $12,676 |
| 2012 | $4,703 -2.3% | $12,676 |
| 2011 | $4,813 +13.8% | $12,676 -24.7% |
| 2010 | $4,228 +10.8% | $16,833 |
| 2009 | $3,816 +4.9% | $16,833 -5% |
| 2008 | $3,638 +7.1% | $17,719 +54.7% |
| 2007 | $3,396 -1% | $11,454 -22.3% |
| 2006 | $3,432 +9.2% | $14,737 +1.1% |
| 2005 | $3,143 -2.8% | $14,582 +29.8% |
| 2004 | $3,232 +3.6% | $11,238 |
| 2003 | $3,119 -1.2% | $11,238 |
| 2002 | $3,156 +7.5% | $11,238 +23.8% |
| 2001 | $2,935 +3.7% | $9,077 |
| 2000 | $2,831 +126.7% | $9,077 |
| 1999 | $1,248 | $9,077 |
Source: MRED as distributed by MLS GRID. This data may not be complete. We recommend contacting the local school district to confirm school assignments for this home.
A local agent can set up tours, give advice and negotiate with sellers.
A local lender can help you make sure your offer is ready when you are.