NO REPRESENTATION TO THE VALIDITY OF INFORMATION IS MADE, BUYER TO VERIFY ALL INFORMATION WHEREIN. Interior inspections are not available; do not trespass!
Sold
Listed by: John L. Scott Des Moines • Cari Franklin • 206-650-6683
Est. $548,300
2302 Lashi Street SE, Olympia, WA 98513
4beds
1,734sqft
Single Family Residence
Built in 1978
0.44 Acres Lot
$-- Zestimate®
$316/sqft
$-- HOA
Overview
- --
- on Zillow
- 16
- views
- 0
- saves
Zillow last checked:
Listing updated:
Listed by:
Cari Franklin 206-650-6683 carifranklingroup@outlook.com,
John L. Scott Des Moines
Source: NWMLS as distributed by MLS GRID,MLS#: 2436173
Facts & features
Interior
Bedrooms & bathrooms
- Bedrooms: 4
- Bathrooms: 2
- Full bathrooms: 1
- 3/4 bathrooms: 1
Bedroom
- Level: Lower
Bathroom three quarter
- Level: Lower
Entry hall
- Level: Main
Heating
- Forced Air, Electric, Natural Gas
Cooling
- None
Features
- Basement: Finished
- Has fireplace: No
- Fireplace features: Gas
Interior area
- Total structure area: 1,734
- Total interior livable area: 1,734 sqft
Property
Parking
- Total spaces: 2
- Parking features: Attached Garage
- Has attached garage: Yes
- Covered spaces: 2
Features
- Levels: Multi/Split
- Entry location: Main
Lot
- Size: 0.44 Acres
Details
- Parcel number: 57550001600
- Special conditions: Auction,Standard
Construction
Type & style
- Home type: SingleFamily
- Architectural style: Split Entry
- Property subtype: Single Family Residence
Materials
- Metal/Vinyl
- Foundation: Poured Concrete
- Roof: Composition
Condition
- Year built: 1978
- Major remodel year: 1978
Utilities & green energy
- Sewer: Septic Tank
- Water: Public
Community & HOA
Community
- Subdivision: Olympia
Location
- Region: Olympia
Financial & listing details
- Price per square foot: $316/sqft
- Tax assessed value: $548,300
- Annual tax amount: $5,585
- Date on market: 9/20/2025
Foreclosure details
Estimated market value
Not available
Estimated sales range
Not available
$2,552/mo
Price history
| Date | Event | Price |
|---|---|---|
| 11/2/2026 | Sold | $376,000+45.1%$217/sqft |
Source:  NWMLS as distributed by MLS GRID #2436173 Report a problem | ||
| 5/1/2019 | Sold | $259,100+5.8%$149/sqft |
Source: NWMLS as distributed by MLS GRID #1417291 Report a problem | ||
| 3/19/2019 | Pending sale | $245,000$141/sqft |
Source: Bellevue - Regional Office #1417291 Report a problem | ||
| 3/1/2019 | Listed for sale | $245,000+21.3%$141/sqft |
Source: Professional Realty Services #1417291 Report a problem | ||
| 10/19/2018 | Sold | $202,000-30.3%$116/sqft |
Source: NWMLS as distributed by MLS GRID #1378808 Report a problem | ||
| 7/7/2018 | Price change | $289,900-9.4%$167/sqft |
Source: CENTURY 21 Link Real Estate #1306851 Report a problem | ||
| 6/10/2018 | Listed for sale | $320,000+0.6%$185/sqft |
Source: Owner Report a problem | ||
| 3/18/2018 | Listing removed | $318,000$183/sqft |
Source: Owner Report a problem | ||
| 3/14/2018 | Listed for sale | $318,000+112%$183/sqft |
Source: Owner Report a problem | ||
| 6/3/2015 | Sold | $150,000-11.8%$87/sqft |
Source: NWMLS as distributed by MLS GRID #757119 Report a problem | ||
| 3/19/2015 | Listed for sale | $170,000-4.5%$98/sqft |
Source: Century 21 Link Real Estate Report a problem | ||
| 3/13/2014 | Sold | $178,000+54.8%$103/sqft |
Source: Public Record Report a problem | ||
| 3/5/2014 | Price change | $115,000-4.2%$66/sqft |
Source: Auction.com Report a problem | ||
| 1/30/2014 | Price change | $120,000-44.2%$69/sqft |
Source: Auction.com Report a problem | ||
| 1/16/2014 | Listed for sale | -- |
Source: Auction.com Report a problem | ||
| 8/6/2011 | Listing removed | $214,900$124/sqft |
Source: Phil Sharp Homes #202281 Report a problem | ||
| 12/12/2010 | Listed for sale | $214,900+9.1%$124/sqft |
Source: Phil Sharp, 1SG, USA, (RET) #202281 Report a problem | ||
| 12/30/2004 | Sold | $196,900+15.9%$114/sqft |
Source: Public Record Report a problem | ||
| 6/6/2003 | Sold | $169,900$98/sqft |
Source: Public Record Report a problem | ||
Public tax history
| Year | Property taxes | Tax assessment |
|---|---|---|
| 2025 | $5,832 +4.4% | $548,300 +4.7% |
| 2024 | $5,585 +10.7% | $523,500 +2.1% |
| 2023 | $5,047 +0.3% | $512,600 +1% |
| 2022 | $5,030 +0.5% | $507,300 +21.6% |
| 2021 | $5,006 +27.3% | $417,300 +37.5% |
| 2020 | $3,934 +25.8% | $303,500 -2.8% |
| 2019 | $3,126 -15.9% | $312,100 +12.3% |
| 2018 | $3,717 +24% | $277,900 +27.1% |
| 2017 | $2,997 | $218,600 -2.6% |
| 2016 | $2,997 | $224,450 +1.6% |
| 2014 | $2,997 | $220,950 +0.2% |
| 2013 | -- | $220,400 |
| 2012 | $2,518 | -- |
| 2011 | -- | -- |
| 2010 | -- | -- |
| 2009 | $2,816 | -- |
| 2008 | -- | -- |
| 2007 | $2,905 -21.9% | -- |
| 2006 | $3,719 +51.1% | -- |
| 2005 | $2,462 | -- |
| 2004 | -- | -- |
| 2002 | -- | -- |
| 2001 | $1,714 +7.5% | $106,400 +9.9% |
| 2000 | $1,594 | $96,800 |
Find assessor info on the county website
Monthly payment
Climate risks
Neighborhood: 98513


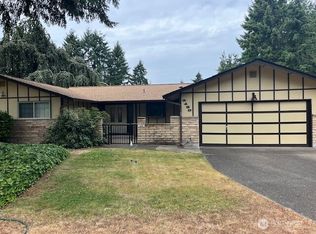
Similar homes
- $--3 bd3 ba2.5k sqft9245 Piperhill Dr SE, Olympia, WA 98513Auction
 Auction.com 2
- $530,0004 bd2 ba2k sqft11033 Kuhlman Road SE, Olympia, WA 98513Active
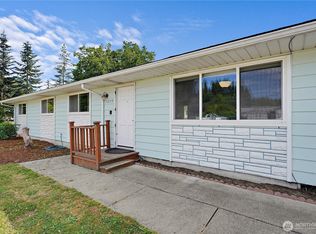 MLS ID #2563973, Jordan Keating. NWMLS as distributed by MLS GRID
- $--3 bd2 ba1.4k sqft10416 Mullen Rd SE, Olympia, WA 98513Auction
 Auction.com 2
- $565,0004 bd3 ba2.1k sqftMadrona Park Div 2, Olympia, WA 98513Active
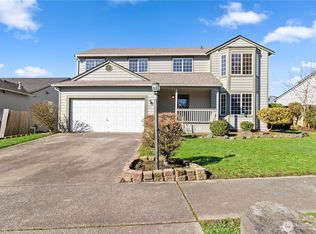 MLS ID #2589413, Kathryn E. Cross Reece. NWMLS as distributed by MLS GRID
