**Portfolio Opportunity!** Investors are invited to explore the opportunity to purchase this property as part of an 10-property investment portfolio featuring residential properties throughout Indianapolis and Shelbyville. Properties are also available for individual purchase. **Portfolio Properties Include:** - 122 E Mechanic St, Shelbyville, IN - 1609 Harlan St, Indianapolis, IN - 955 N Belleview Pl, Indianapolis, IN - 2127 Sugar Grove Ave, Indianapolis, IN - 1261 W 34th St, Indianapolis, IN - 263 N Tacoma Ave, Indianapolis, IN - 1360 N Dearborn St, Indianapolis, IN - 5600 Rockville Rd, Indianapolis, IN - 6780 N Michigan Rd, Fairland, IN - 58 W Franklin St, Shelbyville, IN (Triplex) Portfolio pricing and availability may vary. Don't miss this opportunity to expand your investment portfolio with multiple properties in one package! Estimated room dimensions; buyers to verify.
Active
$285,000
263 N Tacoma Ave, Indianapolis, IN 46201
4beds
2,325sqft
Residential, Single Family Residence
Built in 1955
4,791 Square Feet Lot
$-- Zestimate®
$123/sqft
$-- HOA
What's special
- 6 days
- 396
- 43
Likely to sell faster than
Zillow last checked:
Listing updated:
Listed by:
Gabriela Gonzalez ggonzalez@highgarden.com,
Highgarden Real Estate
Source: MIBOR as distributed by MLS GRID,MLS#: 22132107
Facts & features
Interior
Bedrooms & bathrooms
- Bedrooms: 4
- Bathrooms: 3
- Full bathrooms: 3
- Main level bathrooms: 2
- Main level bedrooms: 2
Primary bedroom
- Level: Main
- Area: 173.24 Square Feet
- Dimensions: 12.2X14.2
Bedroom 2
- Level: Main
- Area: 138 Square Feet
- Dimensions: 12X11.5
Bedroom 3
- Level: Upper
- Area: 203.52 Square Feet
- Dimensions: 12.8X15.9
Bedroom 4
- Level: Upper
- Area: 202.96 Square Feet
- Dimensions: 11.8X17.2
Bonus room
- Level: Upper
- Area: 146.79 Square Feet
- Dimensions: 18.1X8.11
Kitchen
- Level: Main
- Area: 226.72 Square Feet
- Dimensions: 20.8X10.9
Laundry
- Level: Main
- Area: 31.86 Square Feet
- Dimensions: 5.4X5.9
Living room
- Level: Main
- Area: 733.2 Square Feet
- Dimensions: 23.5X31.2
Office
- Level: Upper
- Area: 122.32 Square Feet
- Dimensions: 8.8X13.9
Heating
- Electric, Forced Air
Cooling
- Central Air
Appliances
- Included: Electric Oven
Features
- Attic Access
- Basement: Unfinished
- Attic: Access Only
Interior area
- Total structure area: 2,325
- Total interior livable area: 2,325 sqft
- Finished area below ground: 0
Property
Parking
- Total spaces: 1
- Parking features: Detached
- Garage spaces: 1
Features
- Levels: Two
- Stories: 2
Lot
- Size: 4,791 Square Feet
Details
- Parcel number: 491005175022000101
- Special conditions: As Is
- Horse amenities: None
Construction
Type & style
- Home type: SingleFamily
- Architectural style: Traditional
- Property subtype: Residential, Single Family Residence
Materials
- Vinyl Siding
- Foundation: Block
Condition
- New construction: No
- Year built: 1955
Utilities & green energy
- Water: Public
Community & HOA
Community
- Subdivision: Hubbards
HOA
- Has HOA: No
Location
- Region: Indianapolis
Financial & listing details
- Price per square foot: $123/sqft
- Tax assessed value: $223,900
- Annual tax amount: $5,354
- Date on market: 10/19/2026
- Cumulative days on market: 9 days
Estimated market value
Not available
Estimated sales range
Not available
Not available
Price history
| Date | Event | Price |
|---|---|---|
| 10/19/2026 | Listed for sale | $285,000+256.3%$123/sqft |
Source:  MIBOR as distributed by MLS GRID #22132107 Report a problem | ||
| 3/24/2023 | Sold | $80,000-5.9%$34/sqft |
Source: MIBOR as distributed by MLS GRID #21904791 Report a problem | ||
| 3/6/2023 | Pending sale | $85,000$37/sqft |
Source: MIBOR as distributed by MLS GRID #21904791 Report a problem | ||
| 2/24/2023 | Listed for sale | $85,000$37/sqft |
Source: MIBOR as distributed by MLS GRID #21904791 Report a problem | ||
| 2/10/2023 | Pending sale | $85,000$37/sqft |
Source: MIBOR as distributed by MLS GRID #21904791 Report a problem | ||
| 2/7/2023 | Listed for sale | $85,000-5.6%$37/sqft |
Source: MIBOR as distributed by MLS GRID #21904791 Report a problem | ||
| 9/14/2021 | Listing removed | -- |
Source: MIBOR as distributed by MLS GRID #21798225 Report a problem | ||
| 9/10/2021 | Price change | $90,000-2.7%$39/sqft |
Source: MIBOR as distributed by MLS GRID #21798225 Report a problem | ||
| 9/8/2021 | Listed for sale | $92,500$40/sqft |
Source: MIBOR as distributed by MLS GRID #21798225 Report a problem | ||
| 8/28/2021 | Pending sale | $92,500$40/sqft |
Source: MIBOR as distributed by MLS GRID #21798225 Report a problem | ||
| 8/12/2021 | Price change | $92,500-2.6%$40/sqft |
Source: MIBOR as distributed by MLS GRID #21798225 Report a problem | ||
| 8/2/2021 | Listed for sale | $95,000+146.8%$41/sqft |
Source: MIBOR as distributed by MLS GRID #21798225 Report a problem | ||
| 10/29/2020 | Sold | $38,500-3.5%$17/sqft |
Source: MIBOR as distributed by MLS GRID #21746522 Report a problem | ||
| 10/22/2020 | Pending sale | $39,900$17/sqft |
Source: RE/MAX Realty Group #21746522 Report a problem | ||
| 10/19/2020 | Listed for sale | $39,900-20.2%$17/sqft |
Source: RE/MAX Realty Group #21746522 Report a problem | ||
| 8/24/2018 | Listing removed | $50,000$22/sqft |
Source: Harrison Real Estate #201831344 Report a problem | ||
| 8/19/2018 | Price change | $50,000-16.7%$22/sqft |
Source: Harrison Real Estate #201831344 Report a problem | ||
| 6/14/2018 | Listed for sale | $60,000$26/sqft |
Source: Owner Report a problem | ||
| 6/5/2018 | Pending sale | $60,000$26/sqft |
Source: Owner Report a problem | ||
| 5/30/2018 | Listed for sale | $60,000+300%$26/sqft |
Source: Owner Report a problem | ||
| 1/11/2013 | Listing removed | $15,000$6/sqft |
Source: Owner Report a problem | ||
| 11/13/2012 | Price change | $15,000+66.7%$6/sqft |
Source: Owner Report a problem | ||
| 7/13/2012 | Listed for sale | $9,000+38.5%$4/sqft |
Source: Owner Report a problem | ||
| 1/18/2011 | Listing removed | $6,500$3/sqft |
Source: Econohomes Report a problem | ||
| 10/26/2010 | Price change | $6,500-23.5%$3/sqft |
Source: Econohomes Report a problem | ||
| 8/25/2010 | Listed for sale | $8,500+25%$4/sqft |
Source: Econohomes Report a problem | ||
| 12/2/2009 | Sold | $6,800-43.3%$3/sqft |
Source: Public Record Report a problem | ||
| 6/18/2002 | Sold | $12,000$5/sqft |
Source: MIBOR as distributed by MLS GRID #2210360 Report a problem | ||
Public tax history
| Year | Property taxes | Tax assessment |
|---|---|---|
| 2025 | $3,177 +89.5% | $223,900 +67.2% |
| 2024 | $1,677 +6.8% | $133,900 +89.4% |
| 2023 | $1,570 +36.4% | $70,700 +6.3% |
| 2022 | $1,151 +231.6% | $66,500 +33.3% |
| 2021 | $347 +55.9% | $49,900 +8.2% |
| 2020 | $223 +7.1% | $46,100 +58.4% |
| 2019 | $208 +0.5% | $29,100 +10.2% |
| 2018 | $207 -36.6% | $26,400 +4.3% |
| 2017 | $326 +78.5% | $25,300 +10% |
| 2016 | $183 +8.8% | $23,000 |
| 2014 | $168 +18.9% | $23,000 +27.1% |
| 2013 | $141 | $18,100 +7.1% |
| 2012 | $141 | $16,900 -20.7% |
| 2011 | -- | $21,300 -14.8% |
| 2010 | $524 -2.3% | $25,000 |
| 2009 | $536 | $25,000 -6.4% |
| 2007 | -- | $26,700 -36.1% |
| 2004 | -- | $41,800 |
Find assessor info on the county website
Monthly payment
Est. payment
Payment breakdown
Explore the cost of this home by adjusting the details. Changes won't be saved.Climate risks
Neighborhood: Near Eastside

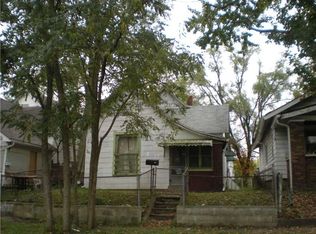
Similar homes
- $299,5004 bd3 ba2.7k sqft247 Hendricks Pl, Indianapolis, IN 46201Active
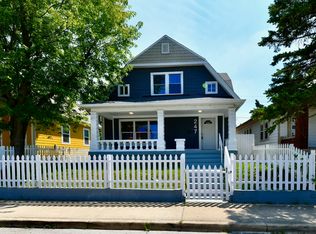 MLS ID #22112381, Gloria Gear, Keller Williams Indy Metro Partners. MIBOR as distributed by MLS GRID
- $300,0003 bd2 ba3.1k sqft314 Jefferson Ave, Indianapolis, IN 46201Active
 MLS ID #22129350, Sathya Kattragadda, CENTURY 21 Scheetz. MIBOR as distributed by MLS GRID
- $299,9953 bd3 ba2.8k sqft124 N Grant Ave, Indianapolis, IN 46201Active
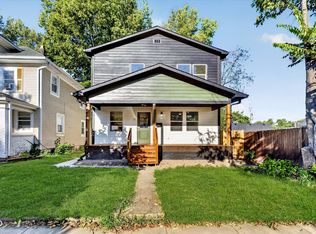 MLS ID #22126197, Antonious Kandil, United Real Estate Indpls. MIBOR as distributed by MLS GRID
- $289,9003 bd4 ba1.9k sqft213 S State Ave, Indianapolis, IN 46201Active
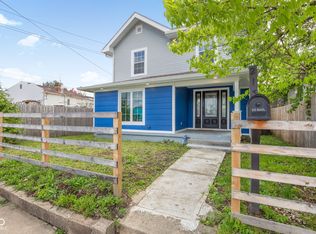 MLS ID #22098506, Aimee Yanis, BluPrint Real Estate Group. MIBOR as distributed by MLS GRID
