$353,800
3 bd|2 ba|1.5k sqft
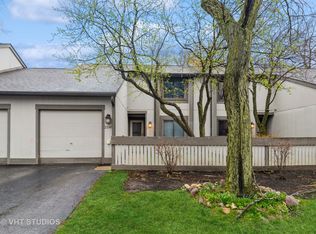
2632 Smith St, Rolling Meadows, IL 60008
Off Market
Likely to sell faster than
Zillow last checked:
Listing updated:
Cynthia Lang (847)340-2973,
Century 21 Integra
Not available
Estimated sales range
Not available
Not available
| Date | Event | Price |
|---|---|---|
| 6/26/2026 | Contingent | $400,000$157/sqft |
Source: | ||
| 6/23/2026 | Listed for sale | $400,000+46.8%$157/sqft |
Source: | ||
| 3/16/2020 | Sold | $272,500-2.6%$107/sqft |
Source: | ||
| 2/15/2020 | Pending sale | $279,900$110/sqft |
Source: RE/MAX Suburban #10616890 Report a problem | ||
| 1/22/2020 | Listed for sale | $279,900+15.4%$110/sqft |
Source: RE/MAX Unlimited Northwest #10616890 Report a problem | ||
| 10/30/2015 | Sold | $242,500-2.8%$95/sqft |
Source: | ||
| 9/13/2015 | Pending sale | $249,500$98/sqft |
Source: RE/MAX Unlimited Northwest #09037381 Report a problem | ||
| 9/13/2015 | Listed for sale | $249,500+5.1%$98/sqft |
Source: RE/MAX Unlimited Northwest #09037381 Report a problem | ||
| 6/21/2013 | Sold | $237,500-6.8%$93/sqft |
Source: Baird & Warnerc #08304985_60008 Report a problem | ||
| 4/23/2013 | Pending sale | $254,900$100/sqft |
Source: Baird & Warner Real Estate #08304985 Report a problem | ||
| 4/2/2013 | Listed for sale | $254,900-17.8%$100/sqft |
Source: Baird & Warner Real Estate #08304985 Report a problem | ||
| 4/27/2006 | Sold | $310,000+37.8%$122/sqft |
Source: Public Record Report a problem | ||
| 10/15/2001 | Sold | $225,000$88/sqft |
Source: Public Record Report a problem | ||
| Year | Property taxes | Tax assessment |
|---|---|---|
| 2024 | -- | $25,000 +0% |
| 2023 | $6,834 +4.2% | $24,998 |
| 2022 | $6,559 +16.2% | $24,998 +26.2% |
| 2021 | $5,642 -23% | $19,804 -8.8% |
| 2020 | $7,329 +0.3% | $21,720 -9.9% |
| 2019 | $7,309 -1.1% | $24,107 +9% |
| 2018 | $7,394 +2.1% | $22,124 |
| 2017 | $7,241 +7.5% | $22,124 |
| 2016 | $6,735 +19.8% | $22,124 +28.2% |
| 2015 | $5,621 -12.1% | $17,262 -14% |
| 2014 | $6,396 +18.1% | $20,061 |
| 2013 | $5,414 +7.2% | $20,061 -1.9% |
| 2012 | $5,052 +2.6% | $20,458 |
| 2011 | $4,925 +1.8% | $20,458 |
| 2010 | $4,837 -9.3% | $20,458 -25.8% |
| 2009 | $5,332 +7.5% | $27,586 -9.3% |
| 2008 | $4,960 +4.9% | $30,430 |
| 2007 | $4,729 +27.4% | $30,430 +29.7% |
| 2006 | $3,711 +6.6% | $23,464 |
| 2005 | $3,482 +4.4% | $23,464 |
| 2004 | $3,334 -1.1% | $23,464 +33% |
| 2003 | $3,370 +3.6% | $17,639 |
| 2002 | $3,254 +19.9% | $17,639 |
| 2001 | $2,713 +1% | $17,639 +17.2% |
| 2000 | $2,687 +1.7% | $15,056 |
| 1999 | $2,642 | $15,056 |
Find assessor info on the county website
Source: MRED as distributed by MLS GRID. This data may not be complete. We recommend contacting the local school district to confirm school assignments for this home.
A local agent can set up tours, give advice and negotiate with sellers.