Recently remodeled 3 years ago and great neighborhood and neighbors. In the influential Korea town part of Seattle suburbs.
For sale by owner
Price cut: $14K (10/27)
$635,000
35803 18th Ave SW, Federal Way, WA 98023
4beds
1,760sqft
Single Family Residence
Built in 1993
5,467 Acres Lot
$-- Zestimate®
$361/sqft
$-- HOA
Overview
- 26 days
- 1,248
- 41
Zillow last checked:
Listed by:
Property Owner (310) 593-3579
Source: FSBO-Online.com
This property is for sale by owner and Zillow, Inc. is displaying it at the owner's request. It is not subject to a listing agreement with Zillow, Inc. or its affiliates.Facts & features
Interior
Bedrooms & bathrooms
- Bedrooms: 4
- Bathrooms: 2
- 1/2 bathrooms: 1
Heating
- Natural Gas
Cooling
- Central Air
Appliances
- Included: Dishwasher, Dryer, Freezer, Microwave, Refrigerator, Washer
Features
- Flooring: Carpet, Hardwood
- Basement: None
Interior area
- Total structure area: 1,760
- Total interior livable area: 1,760 sqft
Property
Parking
- Parking features: Off-street, Garage - Attached
- Has garage: Yes
Lot
- Size: 5,467 Acres
Details
- Parcel number: 3065610120
Construction
Type & style
- Home type: SingleFamily
- Architectural style: Modern
- Property subtype: Single Family Residence
Materials
- Composition
- Roof: Asphalt
Condition
- Year built: 1993
Community & HOA
HOA
- Services included: HOA
Location
- Region: Federal Way
Financial & listing details
- Price per square foot: $361/sqft
- Tax assessed value: $630,000
- Annual tax amount: $6,411
- Date on market: 10/26/2026
- Lease term: Contact For Details
Estimated market value
Not available
Estimated sales range
Not available
$3,016/mo
Price history
| Date | Event | Price |
|---|---|---|
| 10/27/2026 | Price change | $635,000-2.2%$361/sqft |
Source: FSBO-Online.com Report a problem | ||
| 10/26/2026 | Listed for sale | $649,000+8.2%$369/sqft |
Source: FSBO-Online.com Report a problem | ||
| 9/28/2023 | Sold | $600,000-4%$341/sqft |
Source:  NWMLS as distributed by MLS GRID #2137018 Report a problem | ||
| 9/7/2023 | Pending sale | $625,000$355/sqft |
Source: NWMLS as distributed by MLS GRID #2137018 Report a problem | ||
| 7/26/2023 | Price change | $625,000-3.8%$355/sqft |
Source: NWMLS as distributed by MLS GRID #NWM2137018 Report a problem | ||
| 7/12/2023 | Listed for sale | $649,995+40.1%$369/sqft |
Source: NWMLS as distributed by MLS GRID #NWM2137018 Report a problem | ||
| 7/20/2020 | Sold | $464,000+3.2%$264/sqft |
Source: NWMLS as distributed by MLS GRID #1613204 Report a problem | ||
| 6/16/2020 | Pending sale | $449,500$255/sqft |
Source: TRELORA Realty #1613204 Report a problem | ||
| 6/10/2020 | Listed for sale | $449,500+98%$255/sqft |
Source: TRELORA Realty #1613204 Report a problem | ||
| 1/27/2012 | Sold | $227,000-3.4%$129/sqft |
Source: NWMLS as distributed by MLS GRID #293904 Report a problem | ||
| 11/30/2011 | Price change | $234,950-2.1%$133/sqft |
Source: Keller Williams Realty #293904 Report a problem | ||
| 11/12/2011 | Listed for sale | $239,950+71.4%$136/sqft |
Source: Keller Williams Realty #293904 Report a problem | ||
| 9/14/2011 | Sold | $140,000+18.6%$80/sqft |
Source: NWMLS as distributed by MLS GRID #228916 Report a problem | ||
| 8/18/2011 | Price change | $118,000-22.8%$67/sqft |
Source: foreclosure.com Report a problem | ||
| 8/3/2011 | Price change | $152,900-1.3%$87/sqft |
Source: foreclosure.com Report a problem | ||
| 4/9/2011 | Price change | $154,900-3.1%$88/sqft |
Source: Windermere Real Estate/West Campus, Inc. #169871 Report a problem | ||
| 3/14/2011 | Price change | $159,900-3%$91/sqft |
Source: Windermere Real Estate/West Campus, Inc. #169871 Report a problem | ||
| 2/12/2011 | Price change | $164,900-1.8%$94/sqft |
Source: Windermere Real Estate/West Campus, Inc. #169871 Report a problem | ||
| 2/10/2011 | Price change | $167,900-1.2%$95/sqft |
Source: Windermere Real Estate/West Campus, Inc. #169871 Report a problem | ||
| 1/15/2011 | Listed for sale | $170,000+676.3%$97/sqft |
Source: foreclosure.com Report a problem | ||
| 1/11/2011 | Sold | $21,900-86.2%$12/sqft |
Source: Public Record Report a problem | ||
| 4/15/1999 | Sold | $159,000+5%$90/sqft |
Source: Public Record Report a problem | ||
| 1/26/1998 | Sold | $151,400$86/sqft |
Source: Public Record Report a problem | ||
Public tax history
| Year | Property taxes | Tax assessment |
|---|---|---|
| 2025 | $6,411 +6.3% | $630,000 +3.8% |
| 2024 | $6,029 +4.3% | $607,000 +15.2% |
| 2023 | $5,781 +3.2% | $527,000 -7.4% |
| 2022 | $5,600 +8.9% | $569,000 +25.6% |
| 2021 | $5,142 +3.8% | $453,000 +10.5% |
| 2020 | $4,953 +2.7% | $410,000 +1.5% |
| 2019 | $4,823 +8.1% | $404,000 +4.4% |
| 2018 | $4,461 -8.7% | $387,000 +12.8% |
| 2017 | $4,885 +22.9% | $343,000 +10.6% |
| 2016 | $3,974 | $310,000 +7.6% |
| 2015 | $3,974 | $288,000 +5.5% |
| 2014 | $3,974 | $273,000 +39.3% |
| 2013 | $3,974 | $196,000 -1.5% |
| 2012 | -- | $199,000 -10% |
| 2011 | -- | $221,000 -9.4% |
| 2010 | -- | $244,000 |
| 2009 | -- | $244,000 |
| 2007 | -- | $244,000 +6.6% |
| 2006 | -- | $229,000 +8% |
| 2005 | -- | $212,000 +24.7% |
| 2001 | $2,284 +2.9% | $170,000 +6.9% |
| 2000 | $2,220 | $159,000 |
Find assessor info on the county website
Monthly payment
Est. payment
Payment breakdown
Explore the cost of this home by adjusting the details. Changes won't be saved.Climate risks
Neighborhood: 98023
Similar homes
- $569,9003 bd2 ba1.2k sqft1002 SW 348th Place, Federal Way, WA 98023Active
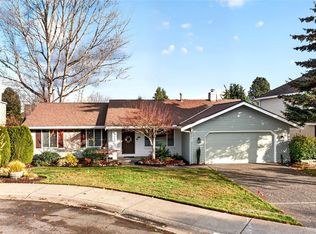 MLS ID #2604659, Candice Frazier. NWMLS as distributed by MLS GRID
- $619,9004 bd3 ba1.9k sqft35111 13th Place SW, Federal Way, WA 98023Active
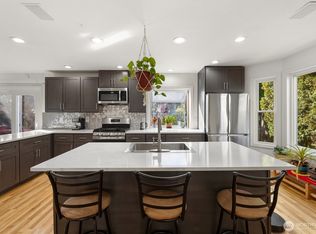 MLS ID #2590244, Dawn L Tinebra. NWMLS as distributed by MLS GRID
- $624,5004 bd3 ba2k sqftTwin Lakes 09, Federal Way, WA 98023Active
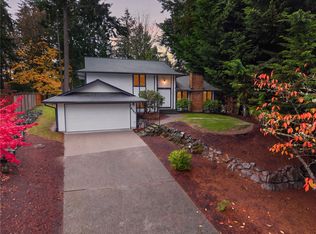 MLS ID #2602532, Stephen Janho. NWMLS as distributed by MLS GRID
- $665,0004 bd3 ba1.8k sqftMadrona Meadow, Federal Way, WA 98023Active
 MLS ID #2562968, Darlene Nguyen-Chapman. NWMLS as distributed by MLS GRID
