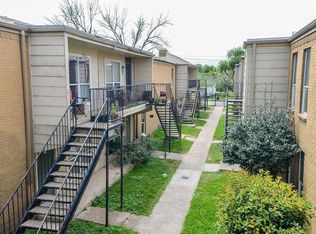
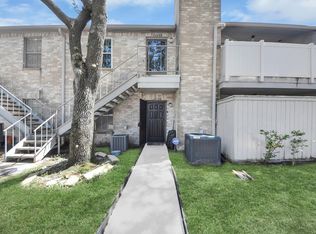
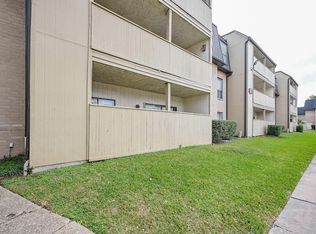
$74,900
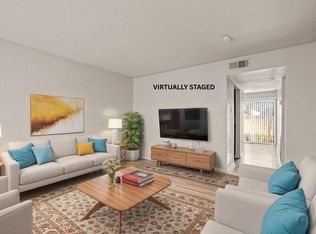
3 bd2 ba1.1k sqft
8100 Creekbend Dr APT 131, Houston, TX 77071
For Sale
Zillow last checked:
Listing updated:
Aliana Stafford TREC #0757676 832-459-0343,
Coton House

Not available
Estimated sales range
Not available
$1,163/mo
| Date | Event | Price |
|---|---|---|
| 10/4/2026 | Price change | $79,000-7.1%$98/sqft |
Source:  HAR #46768989 Report a problem | ||
| 9/16/2026 | Listed for sale | $85,000+9%$105/sqft |
Source: HAR #46768989 Report a problem | ||
| 5/1/2025 | Pending sale | $78,000$97/sqft |
Source: HAR #28762921 Report a problem | ||
| 3/9/2025 | Listing removed | $999$1/sqft |
Source:  HAR #45974051 Report a problem | ||
| 2/15/2025 | Price change | $999-9.2%$1/sqft |
Source: HAR #45974051 Report a problem | ||
| 2/13/2025 | Price change | $1,100-8.3%$1/sqft |
Source: HAR #45974051 Report a problem | ||
| 12/30/2024 | Price change | $78,000-2.5%$97/sqft |
Source: HAR #91101224 Report a problem | ||
| 9/28/2024 | Price change | $1,199-0.1%$1/sqft |
Source: HAR #45974051 Report a problem | ||
| 9/16/2024 | Listed for sale | $80,000+23.1%$99/sqft |
Source: HAR #91101224 Report a problem | ||
| 8/30/2024 | Price change | $1,200-4%$1/sqft |
Source: HAR #45974051 Report a problem | ||
| 8/27/2024 | Price change | $1,250-3.8%$2/sqft |
Source: HAR #45974051 Report a problem | ||
| 8/20/2024 | Listed for rent | $1,300$2/sqft |
Source: HAR #45974051 Report a problem | ||
| 7/8/2024 | Sold | -- |
Source: Agent Provided Report a problem | ||
| 6/18/2024 | Pending sale | $65,000$81/sqft |
Source: HAR #25841344 Report a problem | ||
| 4/28/2024 | Price change | $65,000-7.1%$81/sqft |
Source: HAR #25841344 Report a problem | ||
| 4/8/2024 | Listed for sale | $70,000+3.7%$87/sqft |
Source: HAR #25841344 Report a problem | ||
| 12/16/2023 | Listing removed | -- |
Source: HAR #34058374 Report a problem | ||
| 11/15/2023 | Listed for sale | $67,500$84/sqft |
Source: HAR #34058374 Report a problem | ||
| 8/8/2023 | Pending sale | $67,500$84/sqft |
Source: HAR #34058374 Report a problem | ||
| 7/22/2023 | Listed for sale | $67,500+68.8%$84/sqft |
Source: HAR #34058374 Report a problem | ||
| 2/29/2016 | Listing removed | $39,999$50/sqft |
Source: RE/MAX Inner Loop #39964111 Report a problem | ||
| 2/17/2016 | Pending sale | $39,999$50/sqft |
Source: RE/MAX Inner Loop #39964111 Report a problem | ||
| 2/5/2016 | Listed for sale | $39,999$50/sqft |
Source: RE/MAX Inner Loop #39964111 Report a problem | ||
| Year | Property taxes | Tax assessment |
|---|---|---|
| 2025 | $1,605 +33.8% | $75,536 +31.8% |
| 2024 | $1,199 +5.9% | $57,326 +2% |
| 2023 | $1,133 +6.5% | $56,227 +16.4% |
| 2022 | $1,063 | $48,292 +15.2% |
| 2021 | -- | $41,911 -13.4% |
| 2020 | $1,161 +13.3% | $48,399 +14.3% |
| 2019 | $1,025 +37.1% | $42,341 |
| 2018 | $748 | $42,341 +43.1% |
| 2017 | $748 +6.1% | $29,596 +6.2% |
| 2016 | $704 -1.6% | $27,859 |
| 2015 | $716 | $27,859 |
| 2014 | $716 | $27,859 |
| 2013 | -- | $27,859 |
| 2012 | -- | $27,859 |
| 2011 | -- | $27,859 -18.8% |
| 2010 | -- | $34,293 -18.8% |
| 2009 | -- | $42,254 |
| 2008 | -- | -- |
Source: HAR. This data may not be complete. We recommend contacting the local school district to confirm school assignments for this home.


A local agent can set up tours, give advice and negotiate with sellers.