$322,900
3 bd|1 ba|1.4k sqft
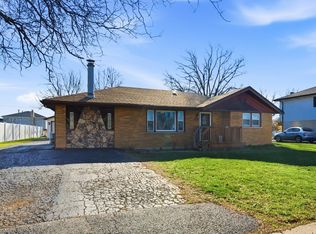
8318 Lamon Ave, Burbank, IL 60459
Off Market
Zillow last checked:
Daisy Esparza 773-908-7927,
United Real Estate-Chicago,
Claudia Ortiz 312-659-8868,
United Real Estate - Chicago
Not available
Estimated sales range
Not available
Not available
| Date | Event | Price |
|---|---|---|
| 6/18/2015 | Sold | $180,000-7.6%$89/sqft |
Source: | ||
| 2/14/2015 | Pending sale | $194,900$97/sqft |
Source: Coldwell Banker Residential Brokerage - Oak Lawn #08830575 Report a problem | ||
| 12/30/2014 | Price change | $194,900-2.5%$97/sqft |
Source: Coldwell Banker Residential Brokerage - Oak Lawn #08830575 Report a problem | ||
| 11/14/2014 | Price change | $199,900-4.8%$99/sqft |
Source: Coldwell Banker Residential Brokerage - Oak Lawn #08830575 Report a problem | ||
| 11/1/2014 | Price change | $209,900-2.3%$104/sqft |
Source: Coldwell Banker Residential Brokerage - Oak Lawn #08830575 Report a problem | ||
| 9/19/2014 | Price change | $214,900-4.4%$107/sqft |
Source: Coldwell Banker Residential Brokerage - Oak Lawn #08676289 Report a problem | ||
| 7/18/2014 | Listed for sale | $224,900$112/sqft |
Source: Coldwell Banker Residential Brokerage - Oak Lawn #08676289 Report a problem | ||
| Year | Property taxes | Tax assessment |
|---|---|---|
| 2024 | -- | $29,000 +0% |
| 2023 | $7,969 +29.2% | $28,999 +49.3% |
| 2022 | $6,169 +3.9% | $19,418 |
| 2021 | $5,936 +2.2% | $19,418 |
| 2020 | $5,808 -15.9% | $19,418 -14.5% |
| 2019 | $6,905 +3% | $22,702 |
| 2018 | $6,706 +3.1% | $22,702 |
| 2017 | $6,505 +14.3% | $22,702 +40.6% |
| 2016 | $5,691 +3.9% | $16,152 |
| 2015 | $5,479 +3.1% | $16,152 |
| 2014 | $5,314 -11.7% | $16,152 -19.4% |
| 2013 | $6,022 +4.1% | $20,032 |
| 2012 | $5,785 +6.2% | $20,032 |
| 2011 | $5,448 +155.9% | $20,032 -11.2% |
| 2010 | $2,129 +4.5% | $22,554 |
| 2009 | $2,037 +1.2% | $22,554 -10% |
| 2008 | $2,014 -9.6% | $25,061 +1.8% |
| 2007 | $2,227 -3.2% | $24,612 |
| 2006 | $2,302 +3.2% | $24,612 |
| 2005 | $2,231 -10.7% | $24,612 +27.6% |
| 2004 | $2,497 -4.3% | $19,283 |
| 2003 | $2,608 -19.3% | $19,283 |
| 2002 | $3,233 +11.6% | $19,283 +12.4% |
| 2001 | $2,897 +1% | $17,156 |
| 2000 | $2,869 | $17,156 |
| 1999 | $2,869 | $17,156 |
Find assessor info on the county website
Source: MRED as distributed by MLS GRID. This data may not be complete. We recommend contacting the local school district to confirm school assignments for this home.
A local agent can set up tours, give advice and negotiate with sellers.
A local lender can help you make sure your offer is ready when you are.