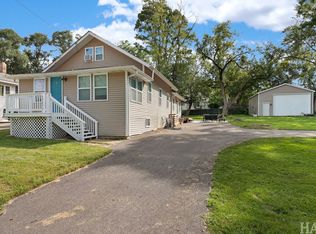
$11,608
-- bd-- ba-- sqft
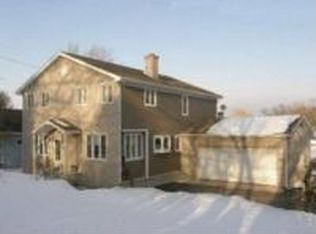
25345 W Rockford St, Ingleside, IL 60041
Off Market
Listing description withheld by the listing agent.
Zillow last checked:
Listing updated:
Emily Smart LeMire (312)401-5949,
Compass,
Lydia Smart Fields 847-224-7771,
Compass

Not available
Estimated sales range
Not available
Not available
| Date | Event | Price |
|---|---|---|
| 10/20/2026 | Listed for sale | $409,900+111.3%$191/sqft |
Source:  MRED as distributed by MLS GRID #12786233 Report a problem | ||
| 11/13/2020 | Sold | $194,000-5.4%$91/sqft |
Source: MRED as distributed by MLS GRID #10902388 Report a problem | ||
| 10/15/2020 | Pending sale | $205,000$96/sqft |
Source: HomeSmart Leading Edge #10902388 Report a problem | ||
| 10/12/2020 | Listed for sale | $205,000$96/sqft |
Source: HomeSmart Leading Edge #10902388 Report a problem | ||
| 10/2/2020 | Pending sale | $205,000$96/sqft |
Source: HomeSmart Leading Edge #10902388 Report a problem | ||
| 9/25/2020 | Listed for sale | $205,000$96/sqft |
Source: HomeSmart Leading Edge #10902388 Report a problem | ||
| 9/19/2020 | Pending sale | $205,000$96/sqft |
Source: HomeSmart Leading Edge #10902388 Report a problem | ||
| 9/12/2020 | Price change | $205,000-4.7%$96/sqft |
Source: HomeSmart Leading Edge #10902388 Report a problem | ||
| 9/6/2020 | Price change | $215,000-4.4%$100/sqft |
Source: HomeSmart Leading Edge #10902388 Report a problem | ||
| 8/31/2020 | Listed for sale | $225,000+220.1%$105/sqft |
Source: HomeSmart Leading Edge #10902388 Report a problem | ||
| 8/18/2012 | Listing removed | $70,300$33/sqft |
Source: Keller Williams - Libertyville #07881105 Report a problem | ||
| 10/31/2011 | Sold | $70,300$33/sqft |
Source: MRED as distributed by MLS GRID #07881105 Report a problem | ||
| 9/16/2011 | Listed for sale | $70,300$33/sqft |
Source: Keller Williams Premier Realty #07881105 Report a problem | ||
| 8/28/2011 | Pending sale | $70,300$33/sqft |
Source: Keller Williams - Libertyville #07881105 Report a problem | ||
| 8/17/2011 | Listed for sale | $70,300+20.2%$33/sqft |
Source: Keller Williams - Libertyville #07881105 Report a problem | ||
| 7/24/2010 | Listed for sale | -- |
Source: Keller Williams #00000 Report a problem | ||
| 6/23/2010 | Sold | $58,500-18.8%$27/sqft |
Source: Public Record Report a problem | ||
| 8/13/1997 | Sold | $72,000$34/sqft |
Source: Public Record Report a problem | ||
| Year | Property taxes | Tax assessment |
|---|---|---|
| 2024 | $5,824 +6.8% | $88,012 +8% |
| 2023 | $5,453 +24.5% | $81,508 +16% |
| 2022 | $4,381 +3.1% | $70,257 +27.4% |
| 2021 | $4,250 +10% | $55,159 +7.6% |
| 2020 | $3,862 +3.7% | $51,250 +4.3% |
| 2019 | $3,725 +7% | $49,146 +3.6% |
| 2018 | $3,483 | $47,430 +8.2% |
| 2017 | $3,483 -7.1% | $43,839 +9.3% |
| 2016 | $3,750 +34.6% | $40,095 +7.2% |
| 2015 | $2,785 -1.6% | $37,416 +26.7% |
| 2014 | $2,830 +9.3% | $29,522 -6.6% |
| 2012 | $2,589 -48% | $31,617 -47% |
| 2011 | $4,974 +16.4% | $59,629 -1.9% |
| 2010 | $4,273 +0.4% | $60,759 -8.7% |
| 2009 | $4,255 +0.7% | $66,577 +0.2% |
| 2008 | $4,226 +32% | $66,477 +2.9% |
| 2006 | $3,201 -2.3% | $64,604 |
| 2005 | $3,278 +13.6% | -- |
| 2004 | $2,886 -6.2% | -- |
| 2003 | $3,076 +3% | -- |
| 2002 | $2,986 -1.5% | -- |
| 2001 | $3,032 +13.1% | $40,457 +3.8% |
| 2000 | $2,682 | $38,963 |
Source: MRED as distributed by MLS GRID. This data may not be complete. We recommend contacting the local school district to confirm school assignments for this home.
A local agent can set up tours, give advice and negotiate with sellers.