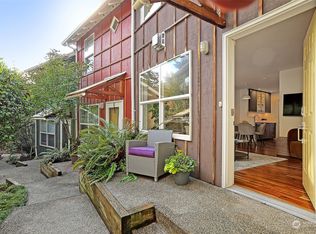
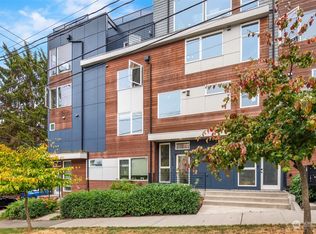
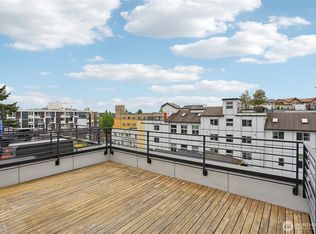
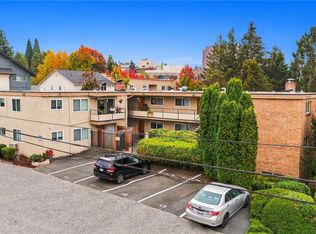
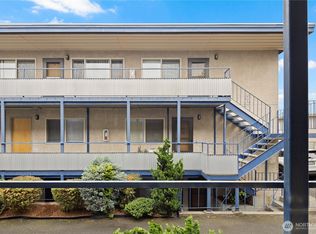
44-unit, 2015-built multifamily investment opportunity in Seattle’s Madison Valley. Madison 2.0 features a mix of SEDUs, studios, one-bedroom homes and live/work lofts with modern finishes, large windows, stainless appliances and efficient floorplans. Community amenities include a rooftop deck with city views, shared kitchen and laundry. Excellent urban location near Capitol Hill, Downtown Seattle, dining, retail, employment centers and transit. Offered at $4.5M ($102,273/unit) with a 6.34% cap rate on current operations and additional rental upside.
Active
Listed by: Kidder Mathews • Max Frame • 360-705-2800
$4,500,000
1811 20th Avenue, Seattle, WA 98122
1beds
4baths
10,855sqft
Multi Family
Built in 2015
-- sqft lot
$4,171,000 Zestimate®
$415/sqft
$-- HOA
What's special
Modern finishesShared kitchenLarge windowsEfficient floorplansStainless appliances
- --
- on Zillow
- 274
- views
- 19
- saves
Zillow last checked:
Listing updated:
Listed by:
Max Frame 360-705-2800 max.frame@kidder.com,
Kidder Mathews
Source: NWMLS as distributed by MLS GRID,MLS#: 2590693
Facts & features
Interior
Bedrooms & bathrooms
- Bedrooms: 1
- Bathrooms: 4
Heating
- Forced Air, Electric
Cooling
- None
Features
- Flooring: Vinyl Plank
- Has fireplace: No
Interior area
- Total structure area: 10,855
- Total interior livable area: 10,855 sqft
Video & virtual tour
Property
Features
- Has view: Yes
- View description: City
Lot
- Size: 4,800 Square Feet
- Dimensions: 4800
Details
- Parcel number: 3043200175
- Zoning description: Multi-Family,Jurisdiction: City
- Special conditions: Standard
Construction
Type & style
- Home type: MultiFamily
- Architectural style: 10+ Units
- Property subtype: Multi Family
Materials
- Wood Products
- Foundation: Slab
- Roof: Flat
Condition
- Good
- Year built: 2015
- Major remodel year: 2015
Utilities & green energy
- Electric: Company: Seattle City Light
- Sewer: Sewer Connected, Company: SPU
- Water: Company: SPU
Community & HOA
Community
- Subdivision: Capitol Hill
Location
- Region: Seattle
Financial & listing details
- Price per square foot: $415/sqft
- Tax assessed value: $6,060,000
- Annual tax amount: $34,987
- Date on market: 10/3/2026
- Listing terms: Conventional
Estimated market value
$4,171,000
$3.96M - $4.38M
Not available
Price history
| Date | Event | Price |
|---|---|---|
| 10/3/2026 | Listed for sale | $4,500,000+718.2%$415/sqft |
Source:  NWMLS as distributed by MLS GRID #2590693 Report a problem | ||
| 8/20/2021 | Listing removed | -- |
Source: Zillow Rental Network Premium Report a problem | ||
| 8/11/2021 | Listed for rent | $1,800+111.8% |
Source: Zillow Rental Network Premium Report a problem | ||
| 12/15/2020 | Listing removed | $850 |
Source: Seattle Rentals Report a problem | ||
| 11/18/2020 | Listed for rent | $850-10.5% |
Source: Seattle Rentals Report a problem | ||
| 8/15/2020 | Listing removed | $950 |
Source: Seattle Rentals Report a problem | ||
| 7/31/2020 | Price change | $950-24% |
Source: Seattle Rentals Report a problem | ||
| 7/19/2020 | Listed for rent | $1,250-32.4% |
Source: Seattle Rentals Report a problem | ||
| 6/13/2020 | Listing removed | $1,850 |
Source: Seattle Rentals Report a problem | ||
| 6/5/2020 | Listed for rent | $1,850+15.6% |
Source: Seattle Rentals Report a problem | ||
| 9/4/2013 | Listing removed | $1,600 |
Source: Seattle Rentals - Units Available for Rent Report a problem | ||
| 8/28/2013 | Listed for rent | $1,600+6.7% |
Source: Seattle Rentals - Units Available for Rent Report a problem | ||
| 6/13/2013 | Listing removed | $1,500 |
Source: Seattle Rentals - Units Available for Rent Report a problem | ||
| 4/25/2013 | Listed for rent | $1,500 |
Source: Seattle Rentals - Units Available for Rent Report a problem | ||
| 9/15/2011 | Sold | $550,000+129.2%$51/sqft |
Source: Public Record Report a problem | ||
| 12/3/1997 | Sold | $239,950+33.7%$22/sqft |
Source: Public Record Report a problem | ||
| 5/31/1995 | Sold | $179,500$17/sqft |
Source: Public Record Report a problem | ||
Public tax history
| Year | Property taxes | Tax assessment |
|---|---|---|
| 2025 | -- | $3,481,900 -15% |
| 2024 | $38,119 +29.9% | $4,094,600 |
| 2023 | $29,340 +11.4% | -- |
| 2022 | $26,334 -2.9% | $3,191,400 +5.5% |
| 2021 | $27,109 -10% | $3,025,000 -6.2% |
| 2019 | $30,113 +17.7% | $3,225,100 |
| 2018 | $25,593 +273.8% | -- |
| 2016 | $6,846 | $1,765,800 +58.4% |
| 2015 | $6,846 | $1,115,000 +57.3% |
| 2014 | $6,846 | $709,000 +25.5% |
| 2013 | $6,846 | $565,000 +13.5% |
| 2012 | -- | $498,000 |
| 2011 | -- | $498,000 |
| 2010 | -- | -- |
| 2009 | -- | -- |
| 2007 | -- | -- |
| 2006 | -- | -- |
| 2005 | -- | -- |
| 2001 | $90 +33.6% | $299,000 +23% |
| 2000 | $68 | $243,000 |
Find assessor info on the county website
Monthly payment
Est. payment
Payment breakdown
Explore the cost of this home by adjusting the details. Changes won't be saved.Climate risks
Neighborhood: Capitol Hill

Similar homes
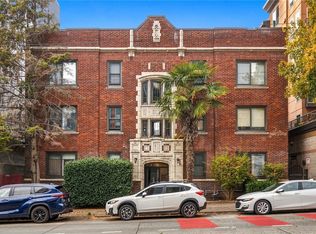
- $4,750,0001 bd3 ba13k sqft307 Queen Anne Avenue N, Seattle, WA 98109Active
 MLS ID #2595687, Max Frame. NWMLS as distributed by MLS GRID
- $3,300,0003 bd2 ba9.9k sqft4001 NE 50th Street, Seattle, WA 98105Active
 MLS ID #2595724, Max Frame. NWMLS as distributed by MLS GRID
- $4,950,0004 bd6 ba7.3k sqft2222 Waverly Way E, Seattle, WA 98112Active
 MLS ID #2578972, Evan H. Wyman. NWMLS as distributed by MLS GRID
- $3,200,0003 bd2 ba9.4k sqft2223 NW 59th Street, Seattle, WA 98107Active
 MLS ID #2592865, Max Frame. NWMLS as distributed by MLS GRID
