$597,700
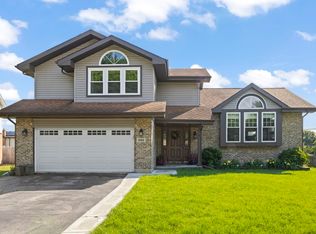
4 bd|3 ba|2.7k sqft
2825 Carriage Way, Aurora, IL 60504
Off Market
Zillow last checked:
Anne Prunty 630-909-9551,
Compass
Not available
Estimated sales range
Not available
Not available
| Date | Event | Price |
|---|---|---|
| 8/4/2017 | Sold | $423,000-3.8%$142/sqft |
Source: | ||
| 6/15/2017 | Pending sale | $439,800$148/sqft |
Source: Berkshire Hathaway HomeServices Elite Realtors #09646571 Report a problem | ||
| 6/3/2017 | Listed for sale | $439,800+99%$148/sqft |
Source: Berkshire Hathaway HomeServices Elite Realtors #09646571 Report a problem | ||
| 10/12/2015 | Listing removed | $221,000$74/sqft |
Source: Owner Report a problem | ||
| 10/10/2015 | Listed for sale | $221,000-43.2%$74/sqft |
Source: Owner Report a problem | ||
| 8/8/2013 | Sold | $389,400-0.1%$131/sqft |
Source: | ||
| 7/2/2013 | Pending sale | $389,900$131/sqft |
Source: Baird & Warner Real Estate #08379908 Report a problem | ||
| 6/27/2013 | Listed for sale | $389,900-10.4%$131/sqft |
Source: Baird & Warner #08379908 Report a problem | ||
| 6/23/2006 | Sold | $435,000$146/sqft |
Source: Public Record Report a problem | ||
| Year | Property taxes | Tax assessment |
|---|---|---|
| 2024 | $11,999 +4.7% | $165,811 +11.3% |
| 2023 | $11,458 +2.8% | $148,990 +7.3% |
| 2022 | $11,142 +2.7% | $138,870 +3.7% |
| 2021 | $10,851 -1.2% | $133,910 |
| 2020 | $10,984 +3.6% | $133,910 +5.1% |
| 2019 | $10,603 -4.1% | $127,370 -2.9% |
| 2018 | $11,050 +1.6% | $131,110 +3.5% |
| 2017 | $10,872 +1.7% | $126,670 +4.2% |
| 2016 | $10,686 +1% | $121,570 +5.3% |
| 2015 | $10,585 -4.9% | $115,430 -1.9% |
| 2014 | $11,125 +1.1% | $117,660 -0.7% |
| 2013 | $11,009 +3.1% | $118,480 -2% |
| 2012 | $10,674 +2.6% | $120,930 -6.4% |
| 2011 | $10,405 +3.8% | $129,240 -2% |
| 2010 | $10,023 +3.1% | $131,850 -4% |
| 2009 | $9,719 +3.1% | $137,340 +1.8% |
| 2008 | $9,429 +4.5% | $134,920 +5.8% |
| 2007 | $9,026 +5.7% | $127,520 +8% |
| 2006 | $8,537 -0.4% | $118,080 +2.6% |
| 2005 | $8,568 +4% | $115,080 +3.8% |
| 2004 | $8,236 +3.6% | $110,870 +6.8% |
| 2003 | $7,946 +11.2% | $103,810 +10.4% |
| 2002 | $7,145 +4.3% | $94,030 +4.7% |
| 2001 | $6,851 +17.2% | $89,820 +15.3% |
| 2000 | $5,846 | $77,880 |
Find assessor info on the county website
Source: MRED as distributed by MLS GRID. This data may not be complete. We recommend contacting the local school district to confirm school assignments for this home.
A local agent can set up tours, give advice and negotiate with sellers.
A local lender can help you make sure your offer is ready when you are.