Upstairs: living room, dining room, 2 bedrooms, full bath, kitchen & sunroom.
Downstairs: 1 bedroom, 1 living room/dining area, full bath
Common Area: laundry room with washer and dryer, furnace room: hot water heater and storage area
2 units ready to rent. Perfect candidate for 3rd story addition with a larger patio.
SERIOUS BUYERS ONLY: PRE-QUALIFIED LETTER OF CREDIT FROM BANK.
BEST OFFER BY NOVEMBER 30, 2026.
For sale by owner
$535,000
5733 N Manton Ave, Chicago, IL 60646
3beds
1,526sqft
SingleFamily
Built in 1921
3,750 Square Feet Lot
$-- Zestimate®
$351/sqft
$-- HOA
What's special
Dining roomFurnace room
What the owner loves about this home
This home has had only 2 owners. It is in a very quiet neighborhood. Close to public transportation, golf course, bike trails, grocery stores, and neighborhood restaurants.
- 5 days
- 231
- 4
Listed by:
Property Owner (312) 671-9416
Facts & features
Interior
Bedrooms & bathrooms
- Bedrooms: 3
- Bathrooms: 2
- Full bathrooms: 2
Heating
- Forced air
Cooling
- Central
Features
- Basement: Finished
Interior area
- Total interior livable area: 1,526 sqft
Property
Parking
- Parking features: Garage - Attached
Features
- Exterior features: Stone
Lot
- Size: 3,750 Square Feet
Details
- Parcel number: 1305414017
Construction
Type & style
- Home type: SingleFamily
Materials
- Frame
- Foundation: Slab
- Roof: Shake / Shingle
Condition
- New construction: No
- Year built: 1921
Community & HOA
Location
- Region: Chicago
Financial & listing details
- Price per square foot: $351/sqft
- Tax assessed value: $300,000
- Annual tax amount: $6,029
- Date on market: 10/18/2026
Estimated market value
Not available
Estimated sales range
Not available
$1,887/mo
Price history
| Date | Event | Price |
|---|---|---|
| 10/18/2026 | Listed for sale | $535,000$351/sqft |
Source: Owner Report a problem | ||
Public tax history
| Year | Property taxes | Tax assessment |
|---|---|---|
| 2024 | $6,029 +5.8% | $30,000 +11.1% |
| 2023 | $5,701 +2.6% | $27,003 |
| 2022 | $5,557 +2.3% | $27,003 |
| 2021 | $5,433 +9.3% | $27,003 +21.1% |
| 2020 | $4,972 -0.2% | $22,306 -10% |
| 2019 | $4,983 +1.7% | $24,785 |
| 2018 | $4,899 +5.7% | $24,785 +15.2% |
| 2017 | $4,635 +7.5% | $21,521 |
| 2016 | $4,313 +9.3% | $21,521 |
| 2015 | $3,946 +14.3% | $21,521 +15.8% |
| 2014 | $3,452 +2% | $18,591 |
| 2013 | $3,384 +1.3% | $18,591 |
| 2012 | $3,339 -18.5% | $18,591 -26.4% |
| 2011 | $4,097 -0.4% | $25,264 |
| 2010 | $4,114 +4.3% | $25,264 |
| 2009 | $3,943 -7.5% | $25,264 -14.9% |
| 2008 | $4,264 +1% | $29,702 |
| 2007 | $4,222 -1.1% | $29,702 |
| 2006 | $4,267 +49.8% | $29,702 +29.5% |
| 2005 | $2,848 +2.4% | $22,935 |
| 2004 | $2,782 +3.7% | $22,935 |
| 2003 | $2,684 -5% | $22,935 +23.7% |
| 2002 | $2,825 +5.8% | $18,546 |
| 2001 | $2,672 +15.1% | $18,546 |
| 2000 | $2,320 | $18,546 +22.3% |
| 1999 | $2,320 | $15,165 |
Find assessor info on the county website
Monthly payment
Est. payment
Payment breakdown
Explore the cost of this home by adjusting the details. Changes won't be saved.Climate risks
Neighborhood: Jefferson Park

Similar homes
- $589,9004 bd3 ba2.2k sqft5747 N Melvina Ave, Chicago, IL 60646New
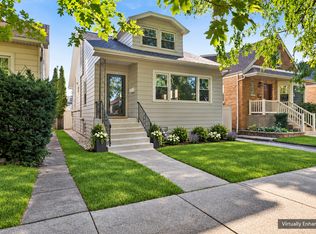 MLS ID #12789390, Nicole Flores, Baird & Warner. MRED as distributed by MLS GRID
- $479,0005 bd3 ba1.3k sqft6332 N Mobile Ave, Chicago, IL 60646New
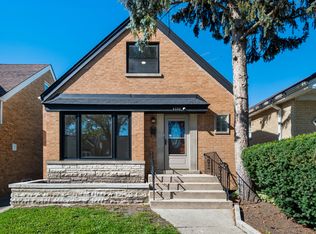 MLS ID #12791550, John Warren, Forte Properties, Inc.. MRED as distributed by MLS GRID
- $519,9005 bd2 ba2k sqft5452 N Luna Ave, Chicago, IL 60630Price Change
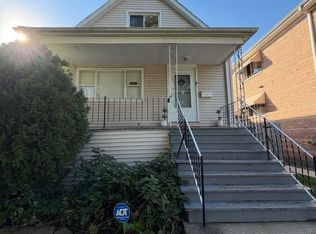 MLS ID #12756606, Zeeshan Bhimji, Real Property Management Group Chicago. MRED as distributed by MLS GRID
- $639,0003 bd2 ba1.9k sqft6681 N Sioux Ave, Chicago, IL 60646New
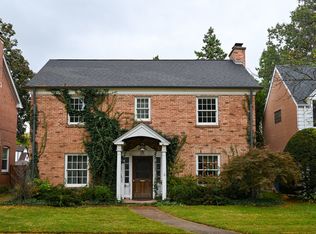 MLS ID #12790230, John C Spieske, Baird & Warner. MRED as distributed by MLS GRID
