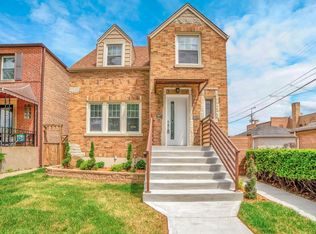
$449,800
5 bd|2 ba|1.6k sqft
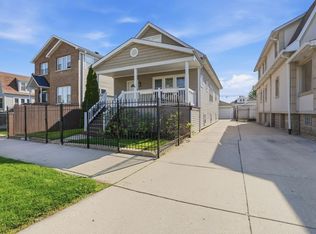
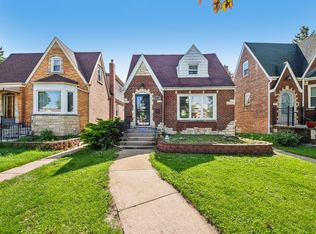
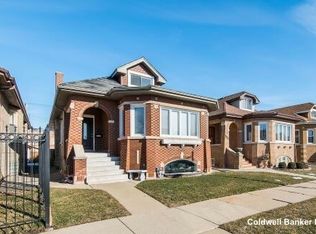
6134 W Fletcher St, Chicago, IL 60634
Off Market
Zillow last checked:
Listing updated:
Beverly Covyeau 773-704-4704,
Chicagoland Brokers, Inc.
Not available
Estimated sales range
Not available
Not available
| Date | Event | Price |
|---|---|---|
| 7/27/2023 | Listing removed | -- |
Source: MRED as distributed by MLS GRID #11826770 Report a problem | ||
| 7/9/2023 | Listed for rent | $2,900+16%$1/sqft |
Source: MRED as distributed by MLS GRID #11826770 Report a problem | ||
| 11/11/2017 | Listing removed | $2,500$1/sqft |
Source: David Dordek Report a problem | ||
| 11/9/2017 | Listing removed | $349,900$146/sqft |
Source: David Dordek #09731311 Report a problem | ||
| 10/28/2017 | Listed for rent | $2,500$1/sqft |
Source: David Dordek Report a problem | ||
| 10/23/2017 | Listed for sale | $349,900+85.1%$146/sqft |
Source: David Dordek #09731311 Report a problem | ||
| 12/12/2015 | Listing removed | -- |
Source: Auction.com Report a problem | ||
| 11/10/2015 | Listed for sale | -- |
Source: Auction.com Report a problem | ||
| 11/10/1999 | Sold | $189,000$79/sqft |
Source: Public Record Report a problem | ||
| Year | Property taxes | Tax assessment |
|---|---|---|
| 2024 | -- | $34,000 +9.7% |
| 2023 | $6,545 +2.6% | $31,001 |
| 2022 | $6,380 +2.3% | $31,001 |
| 2021 | $6,238 +15.4% | $31,001 +27.8% |
| 2020 | $5,407 -1.3% | $24,256 -11% |
| 2019 | $5,479 +1.7% | $27,254 |
| 2018 | $5,387 +12.9% | $27,254 +23.1% |
| 2017 | $4,770 +1.6% | $22,148 -14.6% |
| 2016 | $4,695 +9.9% | $25,924 |
| 2015 | $4,272 +5% | $25,924 +5.9% |
| 2014 | $4,070 +2.3% | $24,487 |
| 2013 | $3,978 +0.7% | $24,487 |
| 2012 | $3,949 -10% | $24,487 -21.3% |
| 2011 | $4,391 +2.6% | $31,114 |
| 2010 | $4,277 +8.8% | $31,114 |
| 2009 | $3,930 +0.1% | $31,114 -8.6% |
| 2008 | $3,926 +10.8% | $34,058 |
| 2007 | $3,541 +27.8% | $34,058 |
| 2006 | $2,771 -3.1% | $34,058 +37.3% |
| 2005 | $2,860 +3.7% | $24,810 |
| 2004 | $2,759 +4.4% | $24,810 |
| 2003 | $2,642 -4.1% | $24,810 +44.7% |
| 2002 | $2,756 +5% | $17,148 |
| 2001 | $2,624 +6.1% | $17,148 |
| 2000 | $2,474 -14% | $17,148 +15.5% |
| 1999 | $2,878 | $14,851 |
Find assessor info on the county website
Source: MRED as distributed by MLS GRID. This data may not be complete. We recommend contacting the local school district to confirm school assignments for this home.
A local agent can set up tours, give advice and negotiate with sellers.