$390,500
3 bd|-- ba|1.1k sqft
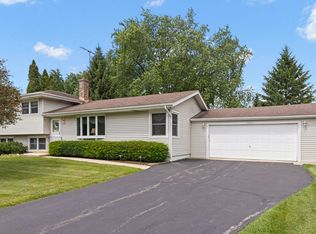
42W458 Kedeka Rd, Sugar Grove, IL 60554
Off Market
Zillow last checked:
Listing updated:
Jonathan Minerick (888)400-2513,
Homecoin.com
Not available
Estimated sales range
Not available
Not available
| Date | Event | Price |
|---|---|---|
| 6/19/2026 | Listed for sale | $470,000+2.2%$145/sqft |
Source: MRED as distributed by MLS GRID #12682487 Report a problem | ||
| 2/7/2026 | Listing removed | $460,000$142/sqft |
Source: | ||
| 9/8/2025 | Price change | $460,000+1.1%$142/sqft |
Source: | ||
| 8/18/2025 | Price change | $455,000+1.1%$141/sqft |
Source: | ||
| 6/11/2025 | Listed for sale | $450,000+8.4%$139/sqft |
Source: | ||
| 8/17/2024 | Listing removed | $415,000$128/sqft |
Source: | ||
| 7/3/2024 | Listed for sale | $415,000$128/sqft |
Source: | ||
| 6/14/2024 | Listing removed | -- |
Source: | ||
| 3/26/2024 | Price change | $415,000+5.1%$128/sqft |
Source: | ||
| 3/1/2024 | Price change | $395,000-2.5%$122/sqft |
Source: | ||
| 2/6/2024 | Price change | $405,000-6.9%$125/sqft |
Source: | ||
| 1/18/2024 | Price change | $435,000-3.3%$135/sqft |
Source: | ||
| 11/14/2023 | Listed for sale | $450,000$139/sqft |
Source: | ||
| 11/10/2023 | Listing removed | -- |
Source: Owner Report a problem | ||
| 11/1/2023 | Listed for sale | $450,000$139/sqft |
Source: Owner Report a problem | ||
| 4/28/2023 | Listing removed | -- |
Source: Owner Report a problem | ||
| Year | Property taxes | Tax assessment |
|---|---|---|
| 2024 | $7,284 +4.9% | $106,642 +10.9% |
| 2023 | $6,944 +0.3% | $96,178 +8.3% |
| 2022 | $6,924 +4.2% | $88,791 +5.1% |
| 2021 | $6,642 +1.6% | $84,499 +2.2% |
| 2020 | $6,536 +1.8% | $82,696 +3.4% |
| 2019 | $6,420 -10.2% | $79,992 -6.9% |
| 2018 | $7,149 +3.6% | $85,939 +4.7% |
| 2017 | $6,903 -11.6% | $82,073 +4.6% |
| 2016 | $7,805 | $78,456 +7.5% |
| 2015 | -- | $72,996 +4.6% |
| 2014 | -- | $69,799 -1% |
| 2013 | -- | $70,533 -5% |
| 2012 | -- | $74,215 -7.8% |
| 2011 | -- | $80,476 +5.2% |
| 2010 | -- | $76,467 -4.4% |
| 2009 | -- | $79,953 +1.7% |
| 2008 | -- | $78,609 +0.4% |
| 2007 | -- | $78,311 +4.6% |
| 2006 | -- | $74,860 +7.7% |
| 2005 | -- | $69,534 +4.8% |
| 2004 | -- | $66,324 +8.7% |
| 2003 | -- | $61,010 +2.2% |
| 2002 | -- | $59,674 +4% |
| 2001 | -- | $57,384 +5.7% |
| 2000 | -- | $54,284 |
Source: MRED as distributed by MLS GRID. This data may not be complete. We recommend contacting the local school district to confirm school assignments for this home.
A local agent can set up tours, give advice and negotiate with sellers.
A local lender can help you make sure your offer is ready when you are.