$359,300
3 bd|2 ba|1.1k sqft
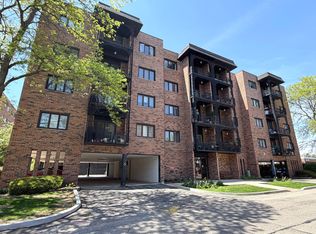
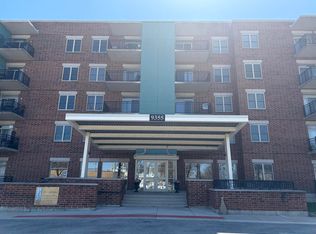
802 Oregon Trl, Roselle, IL 60172
Off Market
Zillow last checked:
Colleen Berg 888-276-9959,
Berg Properties
Not available
Estimated sales range
Not available
Not available
| Date | Event | Price |
|---|---|---|
| 8/14/2024 | Sold | $216,000-1.4%$151/sqft |
Source: Public Record Report a problem | ||
| 3/24/2021 | Listing removed | -- |
Source: Owner Report a problem | ||
| 8/7/2020 | Listing removed | $219,000$153/sqft |
Source: Owner Report a problem | ||
| 5/9/2020 | Price change | $219,000+15.9%$153/sqft |
Source: Owner Report a problem | ||
| 5/3/2020 | Price change | $189,000-17.5%$132/sqft |
Source: Owner Report a problem | ||
| 4/25/2020 | Listed for sale | $229,000+19.3%$160/sqft |
Source: Owner Report a problem | ||
| 1/21/2020 | Sold | $192,000-3.5%$134/sqft |
Source: | ||
| 12/1/2019 | Pending sale | $198,900$139/sqft |
Source: RE/MAX Destiny #10581808 Report a problem | ||
| 11/26/2019 | Price change | $198,900-5.2%$139/sqft |
Source: RE/MAX Destiny #10581808 Report a problem | ||
| 10/31/2019 | Price change | $209,900-4.5%$147/sqft |
Source: RE/MAX Destiny #10581808 Report a problem | ||
| 9/18/2019 | Pending sale | $219,900$154/sqft |
Source: RE/MAX Destiny #10502687 Report a problem | ||
| 8/31/2019 | Listed for sale | $219,900+26.7%$154/sqft |
Source: RE/MAX Destiny #10502687 Report a problem | ||
| 10/1/2011 | Listing removed | $1,500$1/sqft |
Source: RE/MAX City #07895663 Report a problem | ||
| 9/27/2011 | Price change | $1,500-6.3%$1/sqft |
Source: RE/MAX City #07895663 Report a problem | ||
| 9/4/2011 | Listed for rent | $1,600$1/sqft |
Source: RE/MAX City #07895663 Report a problem | ||
| 6/4/2001 | Sold | $173,500+70.1%$121/sqft |
Source: Public Record Report a problem | ||
| 5/25/1994 | Sold | $102,000$71/sqft |
Source: Public Record Report a problem | ||
| Year | Property taxes | Tax assessment |
|---|---|---|
| 2024 | -- | $21,000 |
| 2023 | $6,097 +3.5% | $21,000 |
| 2022 | $5,888 -0.8% | $21,000 +11.5% |
| 2021 | $5,938 +1.6% | $18,835 |
| 2020 | $5,847 -0.7% | $18,835 -11% |
| 2019 | $5,887 -1.8% | $21,163 +8.9% |
| 2018 | $5,993 +1.9% | $19,425 |
| 2017 | $5,880 +22.5% | $19,425 |
| 2016 | $4,800 +8.5% | $19,425 +14.6% |
| 2015 | $4,423 +1.8% | $16,944 |
| 2014 | $4,344 +3.6% | $16,944 |
| 2013 | $4,195 -4.2% | $16,944 -10.8% |
| 2012 | $4,378 +2.2% | $18,997 |
| 2011 | $4,282 +8.4% | $18,997 |
| 2010 | $3,950 -3.5% | $18,997 -20.9% |
| 2009 | $4,092 +26.4% | $24,008 -4% |
| 2008 | $3,238 +11.9% | $25,009 |
| 2007 | $2,895 -7.4% | $25,009 +34.8% |
| 2006 | $3,127 +9.5% | $18,558 |
| 2005 | $2,855 +4.2% | $18,558 |
| 2004 | $2,739 -0.3% | $18,558 +24.6% |
| 2003 | $2,748 +4.8% | $14,891 |
| 2002 | $2,621 -8.7% | $14,891 |
| 2001 | $2,870 +20% | $14,891 +10.9% |
| 2000 | $2,392 +2.7% | $13,424 |
| 1999 | $2,328 | $13,424 |
Find assessor info on the county website
Source: MRED as distributed by MLS GRID. This data may not be complete. We recommend contacting the local school district to confirm school assignments for this home.
A local agent can set up tours, give advice and negotiate with sellers.
A local lender can help you make sure your offer is ready when you are.